3 Innovation Metrics Frameworks
by Stefan Haas

One of the first space jumps, source: wikipedia.org
In 1959 when Joseph Kittinger was leaping from his gondola at 31.3 km height the air was so thin he didn’t feel any drag and the distance was so far he couldn’t see if gravity was moving him at all - leaving him in panic. Would he return back to earth from this first space dive or disappear into space? When product teams set out to explore uncharted territory to find a new value proposition they experience a similar feeling of uncertainty when not having any reference point to measure progress. The question we often get asked: when are we done with discovery?
This tension is a fertile soil for biases to kick-in and restore the feeling of certainty and avoid seeing the situation as is. A typical reaction we see often is to replace the hard question “are we making progress towards the goal” with “are we creating output”, e.g. developing features or feature rich prototypes to tame the underlying angst of failing with the whole idea. When there’s a product out in the market already when we do something new the levers and metrics are different by definition yet it’s so tempting to measure the new with the old framework . So the first step a Product Coach will do is create a safe space so that people can unlearn, are feeling Ok with facing unknowns and avoid falling into the build trap.
The second step is to use an innovation metrics framework that fits discovery work. A good innovation metrics framework keeps teams aligned and helps to make decisions based on evidence during discovery. It is essential to have a scheme of reference and measurement of progress that is outcome and not output based - even though there are only weak signals available. Here are three frameworks that address the problem of making progress visible when dealing with early stage ideas. Use them to start with to design your own.
Confidence Meter
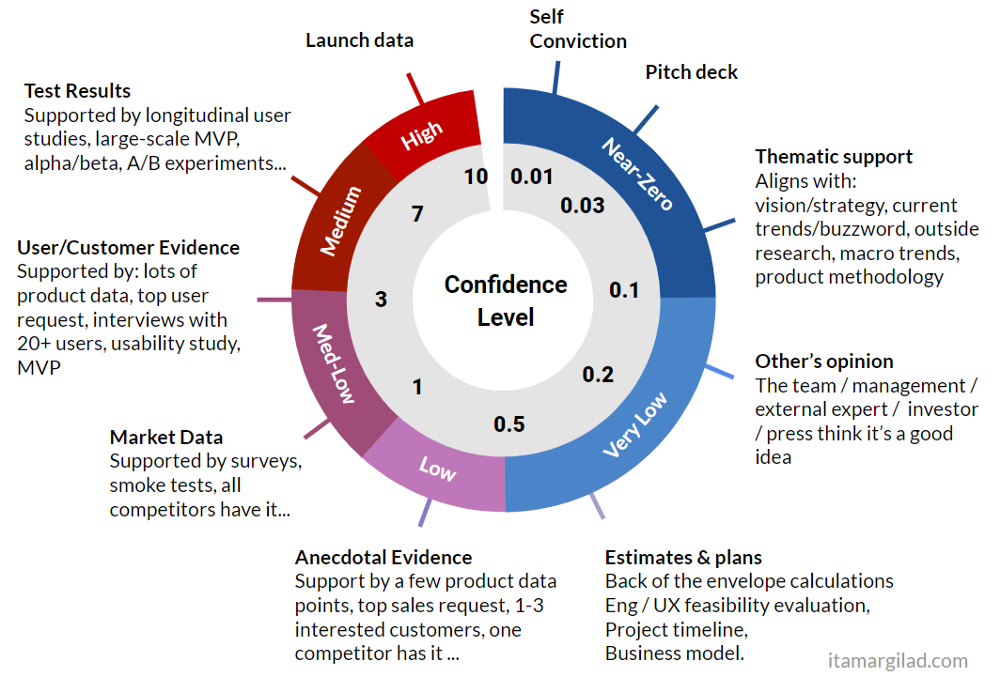
Confidence Meter by Itamar Gilad
The Confidence Meter innovation metrics framework is part of ICE (Impact x Confidence x Evidence) based prioritization of product ideas. The confidence value is derived from a set of discovery experiments like ‘get other people’s opinion’ equals a 0.2 and ‘launch product (and get data)’ equals 10. The framework doesn’t say much about the amount of experiments that are needed to determine a confidence level but comes with a set of options for each stage and we highly recommend triangulating by using a set of experiments. The model misses the concepts of assumptions and risks that can easily be added. Using assumptions/risk as input we recommend mapping different flows to create evidence: shallow, fast and cheap testing for low risk, more deep testing with more steps for high risk assumptions, so depending on the input there are different flows of activities to move the wheel.
Fun story: when I introduced the model to a founder and CEO of an e-health startup, I found all items on the product portfolio tagged with 7 or higher confidence levels. They were new to product discovery and had just run one GV Design Sprint with us. Asking why he answered: ‘I’m confident that it will work’.
Innovation Project Scorecard
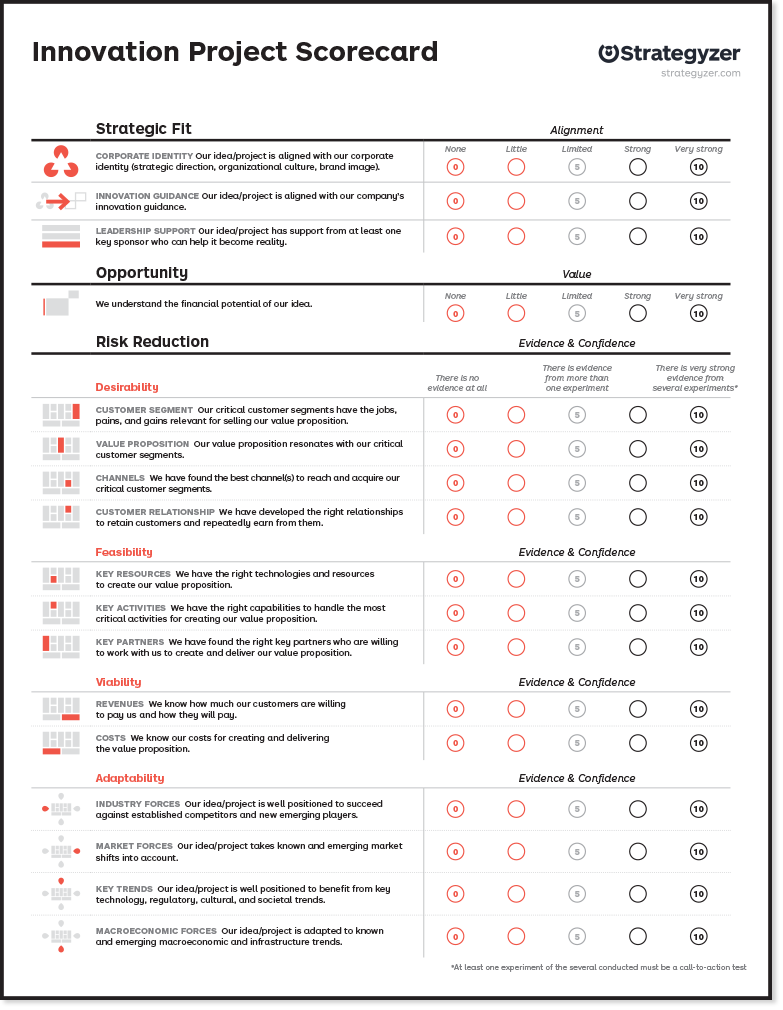
The Innovation Project Score Card, Source: Strategyzer.com
Coming from Business Model Innovation Sprints within corporate innovation programs and startups, this innovation metrics framework clusters the levers of success into Strategic Fit, Opportunity, Risk (Desirable, Feasible, Viable, Adaptable). For those not familiar with the Strategyzer method this may be overwhelming and needs some training to understand the models. Unlike the Confidence Meter the Innovation Project Scorecard innovation metrics framework doesn’t say anything about how to actually gain evidence. That makes it easy to integrate it with any existing testing practice if you have one, or else there are plenty of experiment libraries available like Testing Business Ideas by David J. Bland or the Testing Product Ideas Handbook by Itamar Gilad.
The scope of the tool is on business strategy not product alone and may look too complicated in the first place. Yet we believe that in product everything is connected and a weakness in business strategy may result in a messy product discovery. Getting data for the full Innovation Project Scorecard innovation metrics framework will require product people to work with leadership and that’s a good thing to create alignment.
The Truth Curve

The Truth Curve by Jeff Gothelf
Jeff Gothelf recently shared the Truth Curve on his blog. What we like is that it maps evidence vs. effort. Our standard coaching question is: ‘what’s the fastest/cheapest thing you can do to create evidence for the most riskiest assumption’. We also like that the flow of experiments on the x axis spans the whole idea life cycle from some conversations and prototypes to scaling and optimization. We see teams too often to stop their discovery efforts after the go-live of the first version. As with the Confidence Meter the Truth Curve comes with a defined experiment flow. To make the framework actionable you will need to map your experiment flow to evidence to get started. Since product innovation risk is variable you will want to be flexible with your experiment flows. In the next and final section we explain how to design your own framework.
Design your own Innovation Metrics Framework
When you design your own innovation progress metric, be first clear on what you want to achieve. The benefit of designing your own is you will learn about the elements of a good innovation game, you’ll be able to tweak and change it as needed later on and it’s easier to avoid that people feel measured when they design the metrics themselves. A good innovation metric should guide your thinking to find answers to these questions :
Where are we in the process? In Design Thinking we like to be mindful of the process, knowing where we are on our journey through the double diamond.
What’s the best next action? What type of experiment makes sense to persevere, or shall we pivot or retire the idea?
When are we ready to launch or invest into higher fidelity prototypes?
How can we compare ideas in a portfolio?
How fast are we making progress? Is our team process healthy or are we running in circles?
First start listing the experiments that your team is able to run. If that’s an empty list go do some research and you’ll find a set easily. Then for each experiment you need to know at least what the cost is and what the level of evidence is that we can gain from this experiment. Additionally you may want to tag your experiments for the area of risk to which it brings facts to light, e.g. categorize the experiments into desirability, viability and feasibility.
You may use the 4x4 matrix of say/do/direct/indirect to rank the desirability experiments according to the strength of evidence and for viability when it is about customer or partner risk, too. For feasibility and other viability risks e.g. can we hire a team, the experiment - evidence level mapping is less obvious and we recommend to experiment with what works in your domain.
When you have created the mapping it’s straightforward to compile the level of evidence per product idea in your portfolio using a spreadsheet. And when you keep track of what tests worked you can come up with patterns of test sequences that make the score card even more actionable by telling you what’s the best next action to take.
How to select the next best experiment
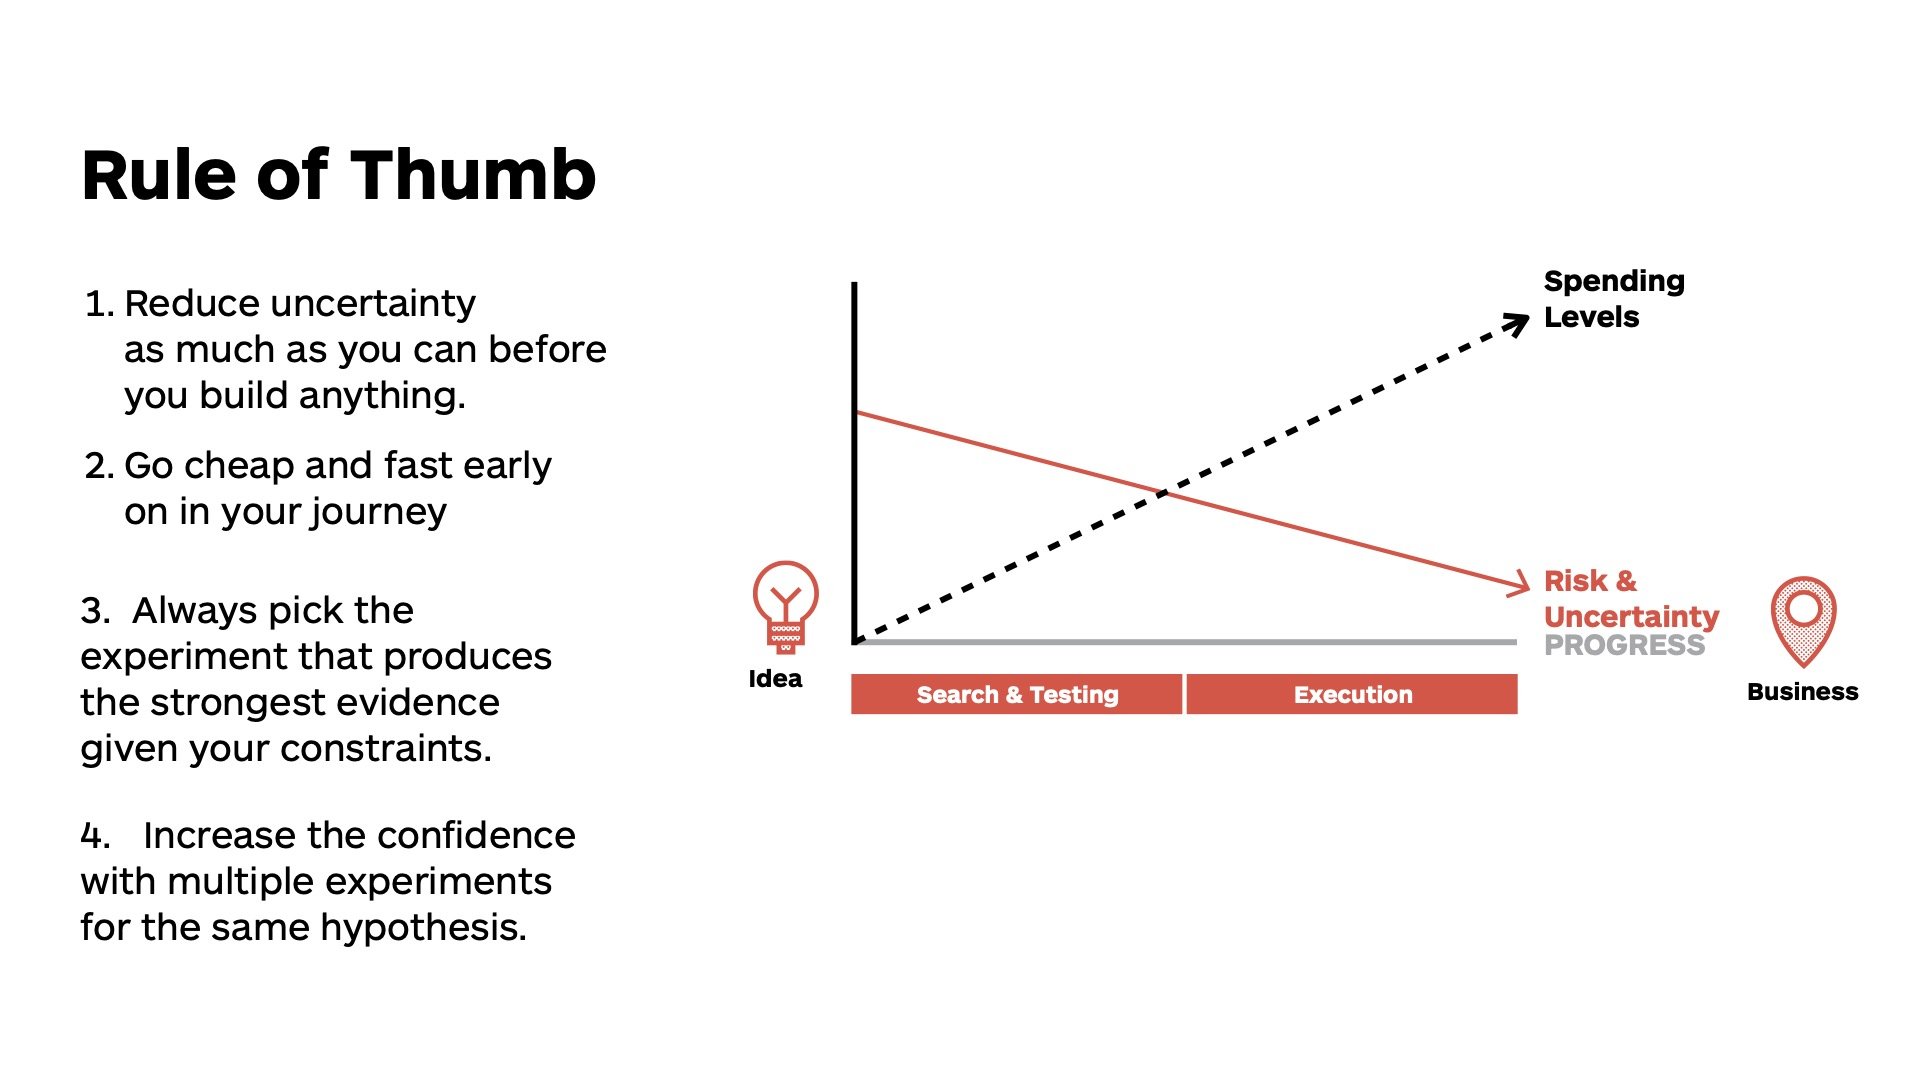
Source: Strategyzer Coach Bootcamp 2022
To reduce uncertainty effectively work from fast and inexpensive (and often low level of evidence) towards expensive and high level of evidence experiments. The input for testing comes from assumption mapping and needs to be prioritized by risk.
To assess risk simply use the team's judgment or calculate 1/level of evidence times impact. For example you may decide for a high risk assumption your next best experiment is to triangulate and run 2-3 separate experiments with the same method for it, while for another one you may choose to just skip testing, or running a short simple test that is good enough.
Don’t over-engineer testing, you may decide just to launch when it’s cheaper to do and you’re flexible enough to tweak the solution when it’s shipped already. And last but not least, when this sounds all very technical, scientific we believe that intuition matters and tools are only there to inform human decision making, that's the art - and fun - in the product, it’s non-linear.
Ressources
When to Use Which User-Experience Research Methods
Testing Product Ideas Handbook
The Innovation Project Score Card
Idea Prioritization With ICE and The Confidence Meter
20 Biases Affecting Decision Making in Product
Testing Business Ideas: A Field Guide for Rapid Experimentation